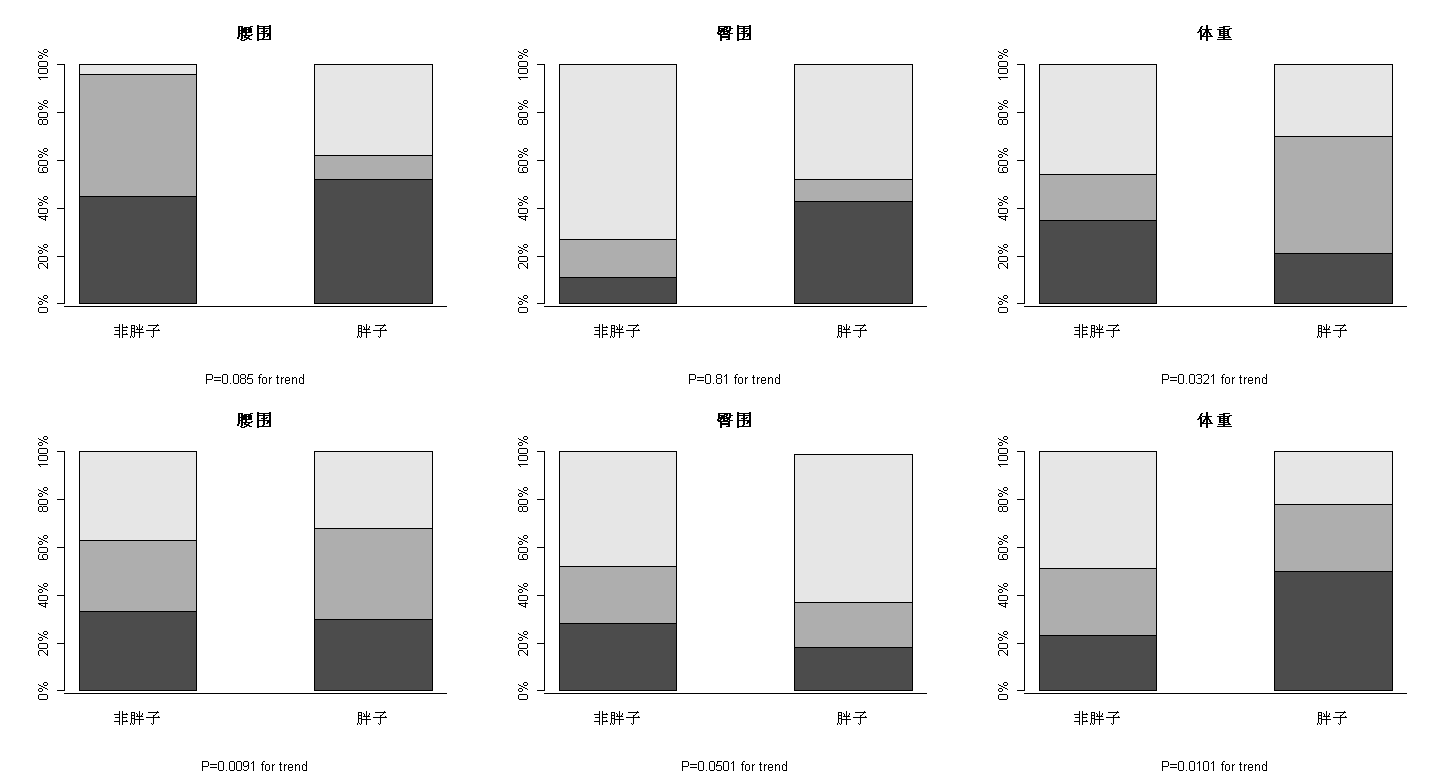
根据结果画图说明
- data1<-sample(1:50,18)
- data2<-sample(51:10,18)
- data1<- matrix(data1,nrow=3)
- data2<- matrix(data2,nrow=3)
- datab<-round(sapply(1:6,function(x) data1[,x]/sum(data1[,x])),digits=2)*100
- ldatab<-round(sapply(1:6,function(x) data2[,x]/sum(data2[,x])),digits=2)*100
- colnames(datab)<-rep(c("非胖子","胖子"),3)
- colnames(ldatab)<-rep(c("非胖子","胖子"),3)
- par(mfrow=c(2, 3))
- barplot(datab[,1:2],sub ="P=0.085 for trend",space=1,main="腰围",axes=F);
- axis(1,labels=F,at=c(0,9))
- axis(2,at=seq(from=0,to=100,by=20),labels=c("0%","20%","40%","60%","80%","100%"))
- barplot(datab[,3:4],sub ="P=0.81 for trend",space=1,main="臀围",axes=F);
- axis(1,labels=F,at=c(0,9))
- axis(2,at=seq(from=0,to=100,by=20),labels=c("0%","20%","40%","60%","80%","100%"))
- barplot(datab[,5:6],sub ="P=0.0321 for trend",space=1,main="体重",axes=F);
- axis(1,labels=F,at=c(0,9))
- axis(2,at=seq(from=0,to=100,by=20),labels=c("0%","20%","40%","60%","80%","100%"))
- barplot(ldatab[,1:2],sub ="P=0.0091 for trend",space=1,main="腰围",axes=F);
- axis(1,labels=F,at=c(0,9))
- axis(2,at=seq(from=0,to=100,by=20),labels=c("0%","20%","40%","60%","80%","100%"))
- barplot(ldatab[,3:4],sub ="P=0.0501 for trend",space=1,main="臀围",axes=F);
- axis(1,labels=F,at=c(0,9))
- axis(2,at=seq(from=0,to=100,by=20),labels=c("0%","20%","40%","60%","80%","100%"))
- barplot(ldatab[,5:6],sub ="P=0.0101 for trend",space=1,main="体重",axes=F);
- axis(1,labels=F,at=c(0,9))
- axis(2,at=seq(from=0,to=100,by=20),labels=c("0%","20%","40%","60%","80%","100%"))

以上数据纯属随机所得,只做实践例子参考。不代表真是结果。 |