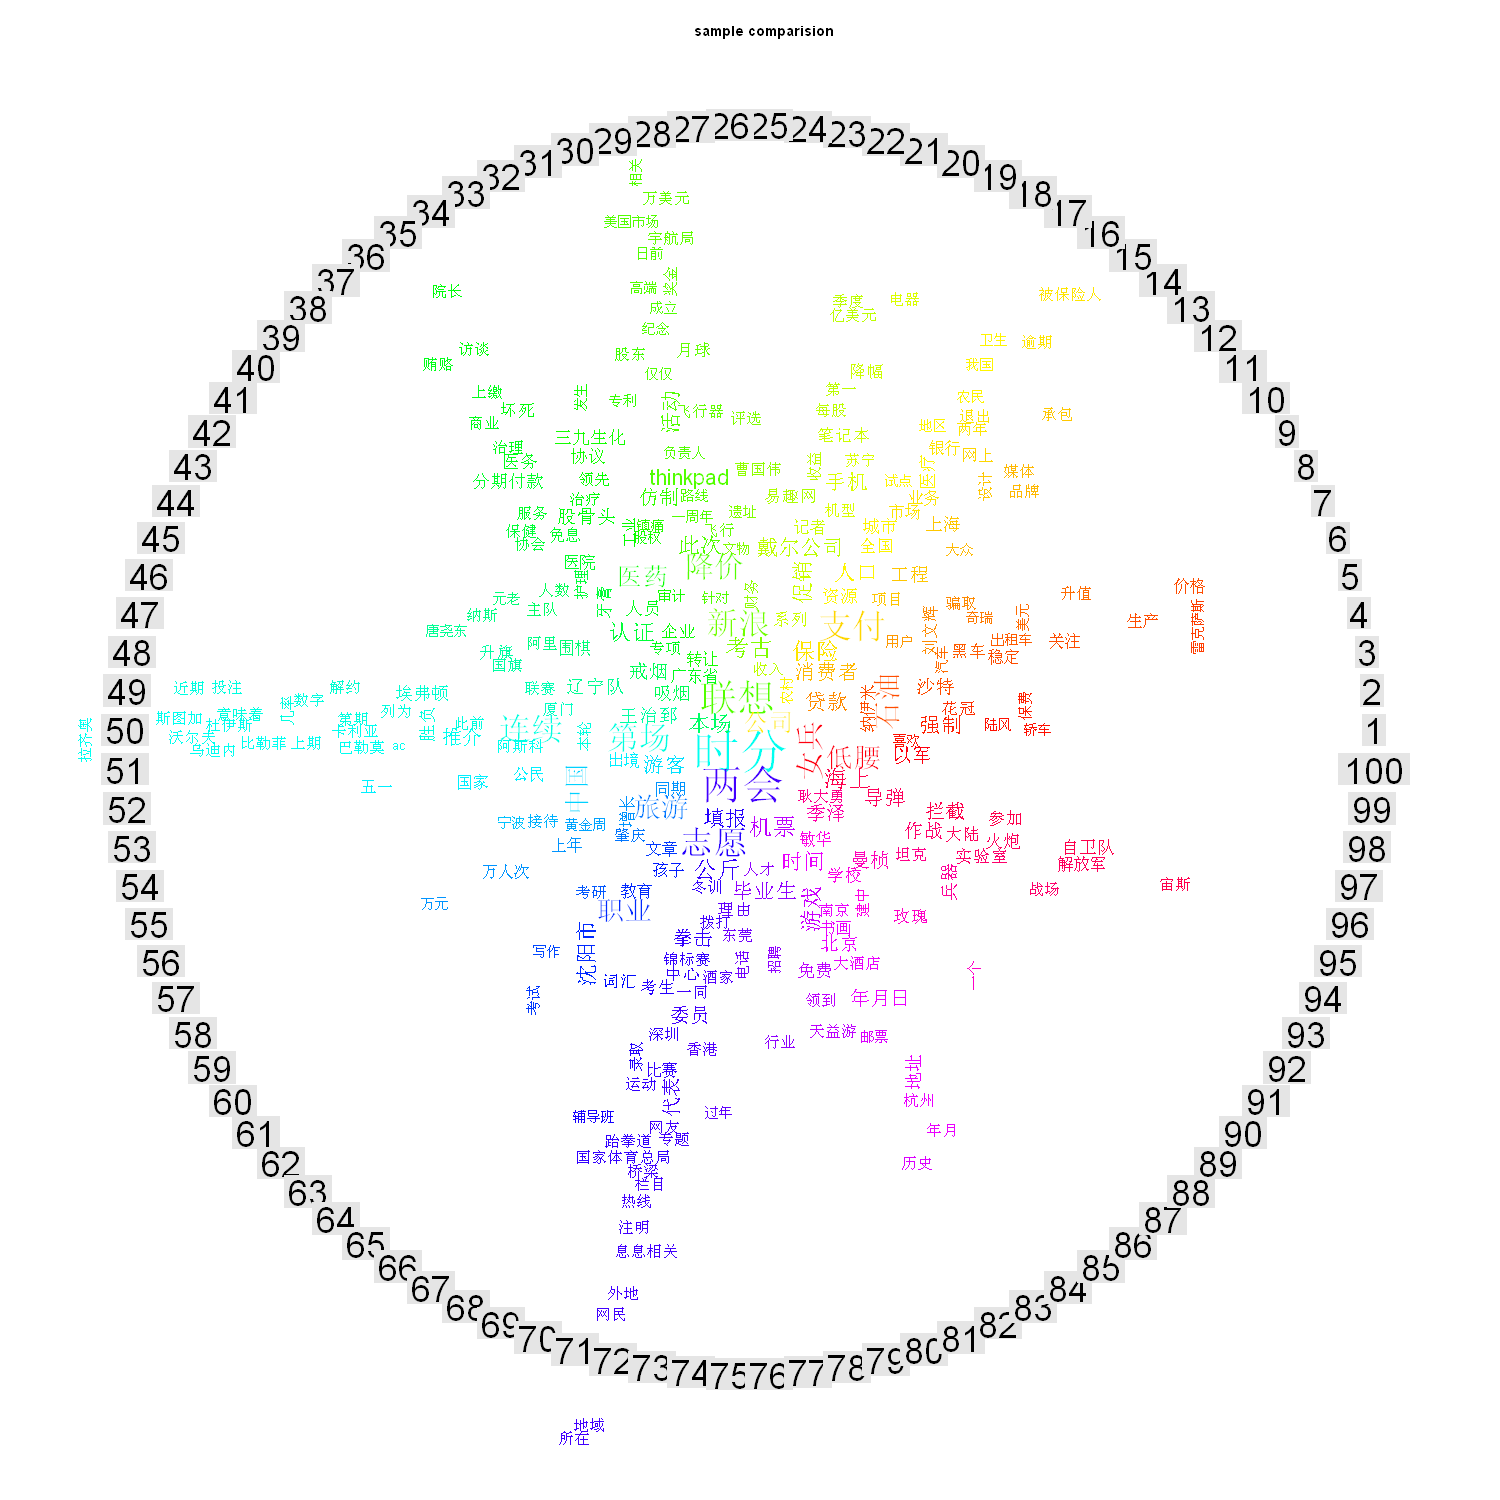
####需要先安装几个R包,如果有这些包,可省略安装包的步骤。
#install.packages("Rwordseg")
#install.packages("tm");
#install.packages("wordcloud");
#install.packages("topicmodels")
例子中所用数据
数据来源于sougou实验室数据。 数据网址:http://download.labs.sogou.com/dl/sogoulabdown/SogouC.mini.20061102.tar.gz 文件结构 └─Sample ├─C000007 汽车 ├─C000008 财经 ├─C000010 IT ├─C000013 健康 ├─C000014 体育 ├─C000016 旅游 ├─C000020 教育 ├─C000022 招聘 ├─C000023 └─C000024 军事 采用Python对数据进行预处理为train.csv文件,并把每个文件文本数据处理为1行。
预处理python脚本
 combineSample.zip
(720 Bytes, 下载次数: 177)
所需数据
 train.zip
(130.2 KB, 下载次数: 300)
大家也可以用R直接将原始数据转变成train.csv中的数据
文章所需stopwords
 StopWords.zip
(2.96 KB, 下载次数: 191)
1. 读取资料库- csv <- read.csv("d://wb//train.csv",header=T, stringsAsFactors=F)
- mystopwords<- unlist (read.table("d://wb//StopWords.txt",stringsAsFactors=F))
数据预处理(中文分词、stopwords处理)
- library(tm);
- #移除数字
- removeNumbers = function(x) { ret = gsub("[0-90123456789]","",x) }
- sample.words <- lapply(csv$$$$text, removeNumbers)
- #处理中文分词,此处用到Rwordseg包
- wordsegment<- function(x) {
- library(Rwordseg)
- segmentCN(x)
- }
- sample.words <- lapply(sample.words, wordsegment)
- ###stopwords处理
- ###先处理中文分词,再处理stopwords,防止全局替换丢失信息
- removeStopWords = function(x,words) {
- ret = character(0)
- index <- 1
- it_max <- length(x)
- while (index <= it_max) {
- if (length(words[words==x[index]]) <1) ret <- c(ret,x[index])
- index <- index +1
- }
- ret
- }
- sample.words <- lapply(sample.words, removeStopWords, mystopwords)
- #构建语料库
- corpus = Corpus(VectorSource(sample.words))
- meta(corpus,"cluster") <- csv$$$$type
- unique_type <- unique(csv$$$$type)
- #建立文档-词条矩阵
- (sample.dtm <- DocumentTermMatrix(corpus, control = list(wordLengths = c(2, Inf))))
- #install.packages("wordcloud"); ##需要wordcloud包的支持
- library(wordcloud);
- #不同文档wordcloud对比图
- sample.tdm <- TermDocumentMatrix(corpus, control = list(wordLengths = c(2, Inf)));
- tdm_matrix <- as.matrix(sample.tdm);
- png(paste("d://wb//sample_comparison",".png", sep = ""), width = 1500, height = 1500 );
- comparison.cloud(tdm_matrix,colors=rainbow(ncol(tdm_matrix)));####由于颜色问题,稍作修改
- title(main = "sample comparision");
- dev.off();

- #按分类汇总wordcloud对比图
- n <- nrow(csv)
- zz1 = 1:n
- cluster_matrix<-sapply(unique_type,function(type){apply(tdm_matrix[,zz1[csv$$$$type==type]],1,sum)})
- png(paste("d://wb//sample_ cluster_comparison",".png", sep = ""), width = 800, height = 800 )
- comparison.cloud(cluster_matrix,colors=brewer.pal(ncol(cluster_matrix),"Paired")) ##由于颜色分类过少,此处稍作修改
- title(main = "sample cluster comparision")
- dev.off()

可以看出数据分布不均匀,culture、auto等数据很少。
- #按各分类画wordcloud
- sample.cloud <- function(cluster, maxwords = 100) {
- words <- sample.words[which(csv$$$$type==cluster)]
- allwords <- unlist(words)
- wordsfreq <- sort(table(allwords), decreasing = T)
- wordsname <- names(wordsfreq)
- png(paste("d://wb//sample_", cluster, ".png", sep = ""), width = 600, height = 600 )
- wordcloud(wordsname, wordsfreq, scale = c(6, 1.5), min.freq = 2, max.words = maxwords, colors = rainbow(100))
- title(main = paste("cluster:", cluster))
- dev.off()
- }
- lapply(unique_type,sample.cloud)# unique(csv$$$$type)


4. 主题模型分析
- library(slam)
- summary(col_sums(sample.dtm))
- term_tfidf <- tapply(sample.dtm$$$$v/row_sums( sample.dtm)[ sample.dtm$$$$i], sample.dtm$$$$j, mean)*
- log2(nDocs( sample.dtm)/col_sums( sample.dtm > 0))
- summary(term_tfidf)
- sample.dtm <- sample.dtm[, term_tfidf >= 0.1]
- sample.dtm <- sample.dtm[row_sums(sample.dtm) > 0,]
- library(topicmodels)
- k <- 30
-
- SEED <- 2010
- sample_TM <-
- list(
- VEM = LDA(sample.dtm, k = k, control = list(seed = SEED)),
- VEM_fixed = LDA(sample.dtm, k = k,control = list(estimate.alpha = FALSE, seed = SEED)),
- Gibbs = LDA(sample.dtm, k = k, method = "Gibbs",control = list(seed = SEED, burnin = 1000,thin = 100, iter = 1000)),
- CTM = CTM(sample.dtm, k = k,control = list(seed = SEED,var = list(tol = 10^-4), em = list(tol = 10^-3)))
- )

- sapply(sample_TM[1:2], slot, "alpha")
- sapply(sample_TM, function(x) mean(apply(posterior(x)$$$$topics,1, function(z) - sum(z * log(z)))))
-

α估计严重小于默认值,这表明Dirichlet分布数据集中于部分数据,文档包括部分主题。
数值越高说明主题分布更均匀
-
- #最可能的主题文档
- Topic <- topics(sample_TM[["VEM"]], 1)
- table(Topic)
- #每个Topic前5个Term
- Terms <- terms(sample_TM[["VEM"]], 5)
- Terms[,1:10]

- ######### auto中每一篇文章中主题数目
- (topics_auto <-topics(sample_TM[["VEM"]])[ grep("auto", csv[[1]]) ])
- most_frequent_auto <- which.max(tabulate(topics_auto))
- ######### 与auto主题最相关的10个词语
- terms(sample_TM[["VEM"]], 10)[, most_frequent_auto]

|