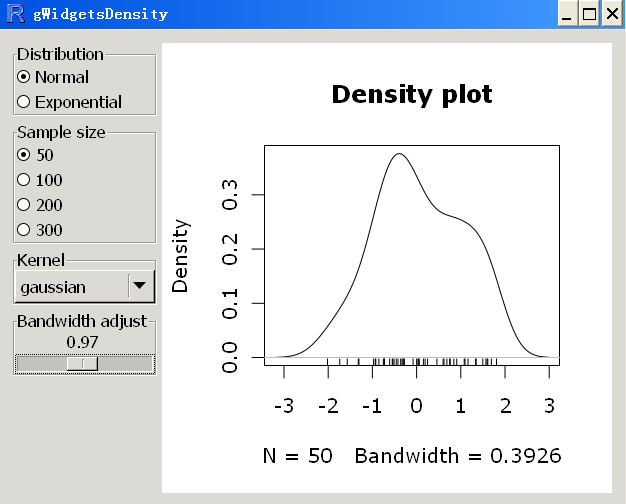
|
|
library(gWidgets)
## set up
gui_plot<-function(){
availDists <- c(Normal="rnorm", Exponential="rexp")
availKernels <- c("gaussian", "epanechnikov", "rectangular",
"triangular", "biweight", "cosine", "optcosine")
updatePlot <- function(h,...) {
x <- do.call(availDists[svalue(distribution)],list(svalue(sampleSize)))
plot(density(x, adjust = svalue(bandwidthAdjust),
kernel = svalue(kernel)),main="Density plot")
rug(x)
}
distribution <- gradio(names(availDists), horizontal=F, handler=updatePlot)
kernel <- gcombobox(availKernels, handler=updatePlot)
bandwidthAdjust <- gslider(from=0,to=2,by=.01, value=1, handler=updatePlot)
sampleSize <- gradio(c(50,100,200, 300), handler = updatePlot)
window <- gwindow("gWidgetsDensity")
BigGroup <- ggroup(cont=window)
group <- ggroup(horizontal=FALSE, container=BigGroup)
tmp <- gframe("Distribution", container=group)
add(tmp, distribution)
tmp <- gframe("Sample size", container=group)
add(tmp,sampleSize)
tmp <- gframe("Kernel", container=group)
add(tmp,kernel)
tmp <- gframe("Bandwidth adjust", container=group)
add(tmp,bandwidthAdjust, expand=TRUE)
add(BigGroup,ggraphics())
}
gui_plot()

主要是滑动条 可以自由变化 |
|