|
|
本帖最后由 genechip 于 2011-12-31 17:05 编辑

data(mtcars)
fit = lm(mpg~., mtcars)
cor = summary(fit, correlation = TRUE)$correlation
#相关阵上下倒转再转置,是为了让画出的图和相关阵方向一致
cor2 = t(cor[11:1,])
#下面颜色取自ellipse包中的plotcorr函数的示例
colors = c("#A50F15", "#DE2D26", "#FB6A4A", "#FCAE91", "#FEE5D9",
"white", "#EFF3FF","#BDD7E7", "#6BAED6", "#3182BD", "#08519C")
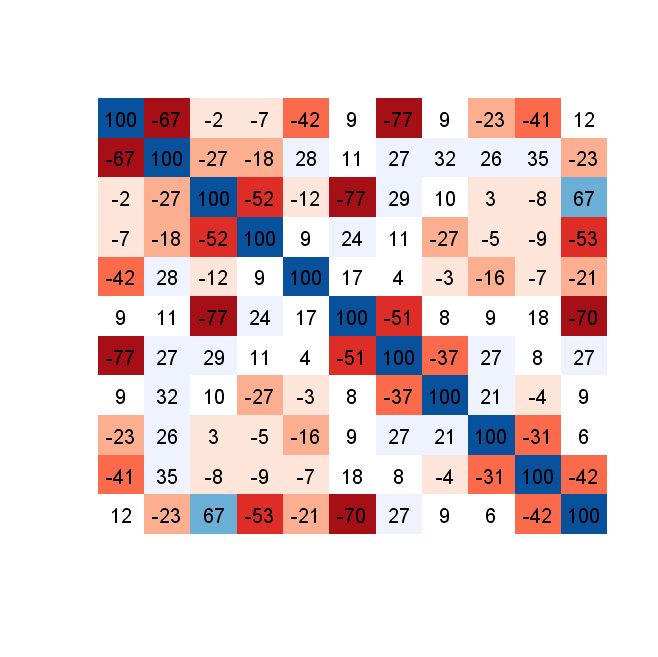
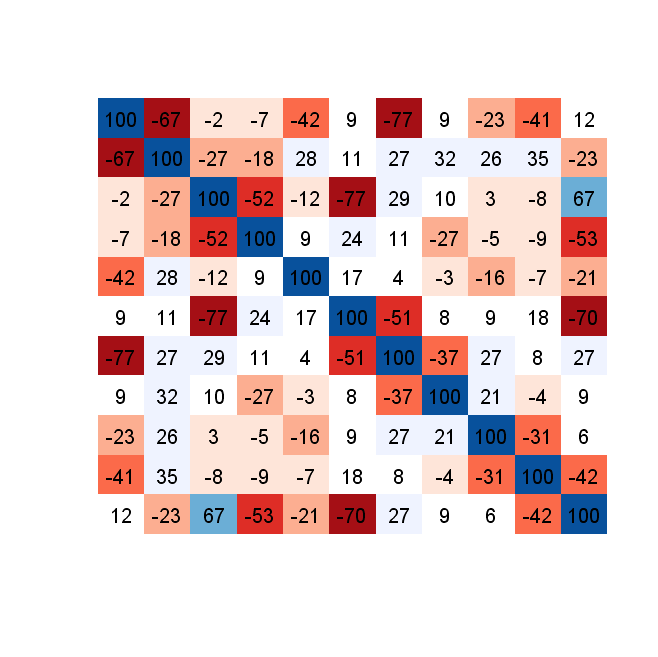
image(1:11,1:11, cor2, axes = FALSE, ann = F,col = colors)
text(rep(1:11, 11),rep(1:11, each = 11), round(100 * cor2))

|
|